Discover TÜV-certified GoogleTest with Agentic AI for C/C++ testing!
Get the Details »

Powered by Parasoft DTP, Parasoft’s Award-Winning Analytics Dashboard
With sophisticated Parasoft dotTEST reporting and analytics, developers and managers can prioritize errors detected in the codebase, including automatically identifying which tests need to be run based on changes in the build. The results of test runs can be viewed on the desktop, web, or in static HTML reports, regardless of where they were executed.
Parasoft dotTEST can perform analysis directly within Microsoft Visual Studio and Visual Studio Code Editor — and as part of the CI/CD pipeline. After analyzing the source code and detecting issues at the earliest stages of development, Parasoft’s award winning Process Intelligence Engine (PIE) analyzes the data collected and provides actionable findings, which you can view on your desktop, the web, or in static HTML reports.
These actionable analytics are presented in Parasoft DTP’s easy-to-use, customizable dashboards made up of highly flexible widgets. You get clear insight into the risks within your codebase and a comprehensive view of software quality.
Parasoft DTP collects and merges data points from Parasoft tools, third-party analysis tools, and external systems, such as bug tracking and requirements tracking systems. It aggregates and prioritizes data, and performs additional analysis to help you optimize development processes. Using your code analysis and dotTEST execution tool with DTP enables you to consistently apply quality practices across teams and throughout the development process.
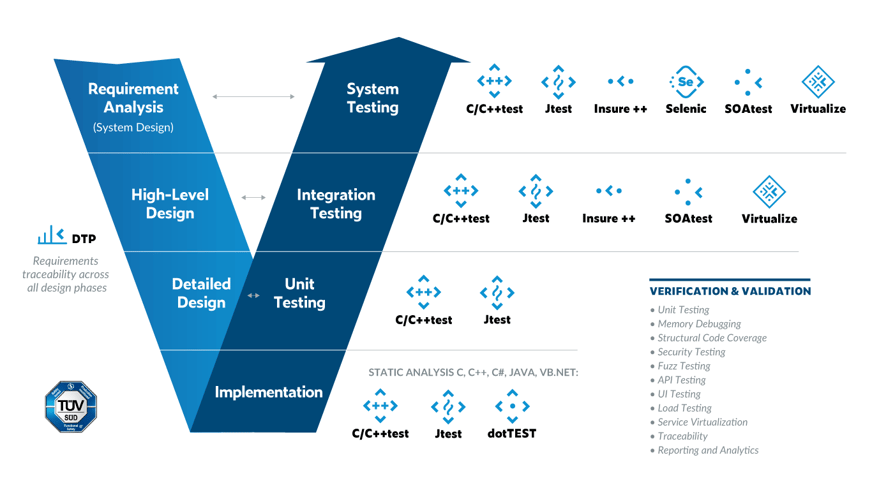
The following illustration shows a general development testing workflow.
Reports can also be published in various formats (HTML, PDF, Custom XSL, SATE XML, and xUnit) and users can configure report settings to specify the content and location for the local analysis reports. Reports are generated in an internal directory by default, but you can enable the Reports option in the Custom locations section and specify a custom directory for your reports.
Release with confidence knowing that a functionality is well tested without the need to run a huge number of tests. Parasoft tracks the changes between different builds and automatically detects new code that might require testing.
Meet your organization’s stringent testing policies and reporting requirements with extensive customization options. For example, you can configure tags to distinguish between different testing sessions, specify whether the report should include suppressed messages, or specify if the report contains a list of the rules that were enabled during analysis.
Parasoft combines data from dotTEST and 15+ other programming languages so you can understand the complete state of software quality, viewing trending analysis as you progress through the software delivery process with intuitive, comprehensive, and fully customizable dashboards to help identify gaps and areas of focus.